| Fields | id_building | id_building3D | ID_class_380/1 | ratio_380/1 | standard_2024 | transformer | day_of_use_d | capita_cap | temperature_interior_C | flow_fresh_air | power_gain_intern_W_m2 | flow_hotwater | annual_simultaneity | gas_grid | area_facade_m2 | area_footprint_m2 | solar_gain_factor | electrical_energy_kWh/y | Geometry |
| Comments | Building ID created in QBuildings | UUID from 3D layer | Building classes from SIA 380/1 | Share of agglomerated EGID in the final building, by area | SIA 2024 standard | ID of the transformer to which the building is associated | Number of days use for hotwater, from SIA 2024 | Number of habitants, from standard of cap/m2 | From SIA 380/1 | Ventilation flow, from SIA 380/1 | – | From SIA 380/1 and SIA 385, in l/cap/d and l/m2 | – | True if connected to the gas grid | Area of the facade, from envelope computation | Area of the footprint, from envelope computation | From SIA 2024 | Electrical demand, from SIA 2024 | Geometry object for GIS database, from envelope computation |
1 Database
1.1 Introduction
GBuildings is a GIS database, containing layers of information for the characterization of the territory from an energy perspective:
- Building stock characterization
- Endogenous resources and energy harvesting / conversion / storage potential
- Meteorological conditions
This tool was developed within IPESE and initiated by Luc Girardin. The development of such framework allowing generation, cross-checking and aggregation of energy data at various spatial scales was motivated by several reasons:
- Building energy data are dispersed in various existing files and databases;
- Real measurement and physical parameters of urban energy systems are sparse;
- Energy standards and building typification are well known but at building-level;
- From the energy transition perspective, there is a need for a building-level to a district-level aggregation.
The structure of the software can be seen in Figure 1.1. It comprises a database, a python repository, and a file repository for the external data. An SQL database is divided into three schemes (numbers 1, 2, 3). Those schemes are constructed by collecting external data stored on a drive (4). Each database is related to a folder on the drive containing the input layers. Python methods are used to treat each input layer accordingly (5).

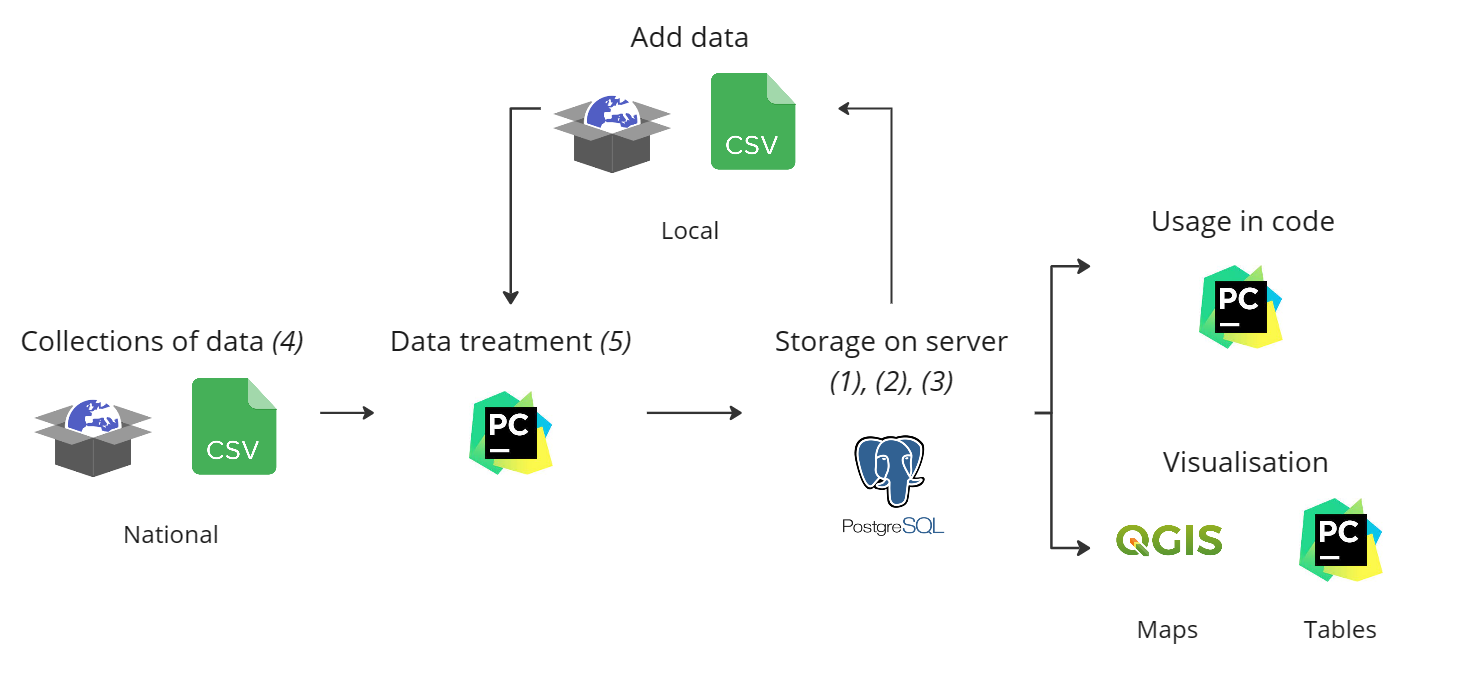 .
.
As can be seen, Python is used to manipulate the database (read and update), through SQL requests, translated by SQLalchemy package.
1.2 Description of the layers
1.2.1 Aggregated
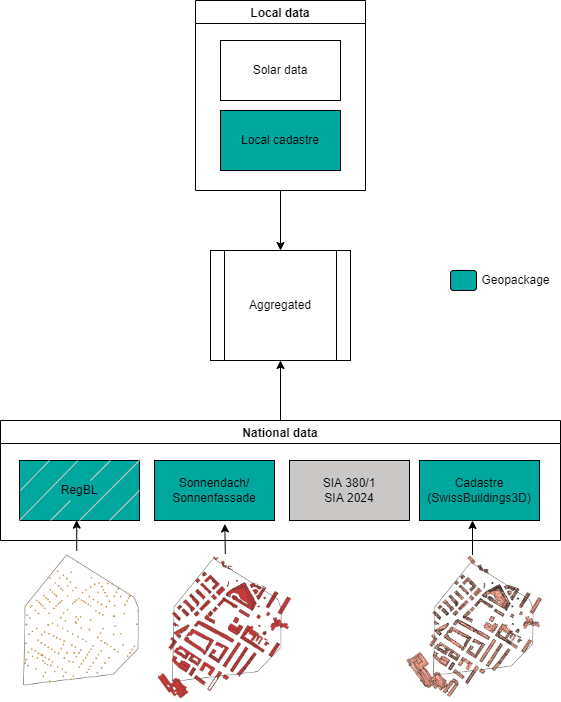
This layer is used to centralise and merge raw data from diffuse information. It starts with data available at the national scale (mandatory) and, if available, uses local data from the area of interest (cities or cantons often have data of their own). Figure 1.2 sums up the minimum set of input layers used to construct a data set. In detail:
- The RegBL is the Swiss federal register of housing and buildings. It catalogues information on buildings, housings and streets. The interest is in the buildings’ information, referenced by street addresses and linked to a Universally Unique Identifier (UUID), named EGID.
- Cadaster refers to swissBuildings3D, a federal data set that describes buildings geometries in three dimensions, with a high degree of detail. It is constructed based on aerial photo-strips (“swissBUILDINGS3D 2.0. Federal Office of Topography Swisstopo” n.d.).
- Sonnendach is a project conducted in Switzerland to build a “solar cadaster”. The data set references every roof and facade in Switzerland and estimates the solar potential and useful surface for each of them (Daniel Klauser 2016).
- SIA 2024 and SIA 380/1 are standards. SIA 2024 is the standard for Space usage data for energy and building facilities (Brüttisellen-Zurich 2021), and SIA 380/1 is the standard for Heat requirements for heating (Brüttisellen-Zurich 2016). These two standards categorise buildings according to their usage: housing (collective or individual), administrative, school, etc., and define typical characteristics for each type of building. A surface normalises the data; the ERA for SIA 380/1 and the net floor area for SIA 2024.
Additionally, GBuildings uses meteorological data (external temperatures and solar irradiance) from Meteonorm (J. Remund 2003).
The following describes the tables and their fields.
| Fields | egid | id_building | period | class | area_era_m2 | area_net_floor_m2 | is_hotwater_system | source_heating | source_hotwater | Geometry |
| Comments | EGID identifier from RegBL | ID created in QBuildings | Period of construction | Class for buildings characterisation, adapted from RegBL classes | Computed from footprint area and number of floor if not available | – | True if hot water is needed | Energy carrier for heating (oil, gas, …) | Energy carrier for hot water production (oil, gas, …) | Geometry object, point corresponding to EGID |
| Fields | id_roof | egid | id_building | id_building3D | roof_solar_area | mean_annual_irradiance | roof_annual_irradiance | tilt | azimuth | Geometry |
| Comments | UUID from Sonnendach | EGID identifier | ID created in QBuildings | UUID from 3D | Useful roof area | In kWh/m2/y | Total irradiance on the roof, in kWh/y | In degree | Orientation, in degree | Geometry object, polygons |
| Fields | id_facade | egid | id_building | id_building3D | facade_solar_area | mean_annual_irradiance | facade_annual_irradiance | azimuth | Geometry |
| Comments | UUID from Sonnenfassade | EGID identifier | ID created in QBuildings | UUID from 3D | Useful facade area | In kWh/m2/y | Total irradiance on the facade, in kWh/y | Orientation, in degree | Geometry object, lines |
| Fields | id | P_load | Q_load | id_HV | id_EHV | Geometry |
| Comments | Transformer ID created in QBuildings | Active power, in kW | Reactive power, in kW | ID of the High Voltage transformer to which it is linked | ID of the Extra High Voltage transformer to which it is linked | Geometry object, polygon |
1.2.2 Processed
This layer computes the energy signature of the building, that is, its heating and cooling energy needs and the hot water energy need. The computation is based on a characterisation of the building envelope according to the building class (Residential, Industrial, etc.) and period (<1919, 1919-1930, etc.). This characterisation has been done on a building sample from Geneva in Girardin (2012). The thermal coefficients have been calculated using known heat demands and surfaces and crossed with temperature data. The data from the buildings tables and the RegBL are grouped, and the corresponding thermal coefficient for each building is identified so that the heating demand can be computed (using hourly temperature data). The SIA data’s ventilation losses, hot water demand, and waste production are also computed with the combined data. Finally, the solar gains are computed using hourly meteorological data over a year.
It is relevant to highlight that the Sonnendach and Sonnenfassade data have a shadow model.
The obtained tables for that layer are described hereafter.
| Fields | id_building | x | y | z | egid | id_class | ratio | status | transformer | gas_grid | capita_cap | area_era_m2 | area_net_floor_m2 | area_roof_solar_m2 | area_facade_m2 | thermal_transmittance_signature_kW_m2_K | thermal_specific_capacity_Wh_m2_K | temperature_interior_C | temperature_heating_supply_C | temperature_heating_return_C | temperature_cooling_supply_C | temperature_cooling_return_C | is_hotwater_system | source_heating | source_hotwater | energy_heating_signature_kWh_y | energy_cooling_signature_kWh_y | energy_hotwater_signature_kWh_y | energy_el_kWh_y | geometry |
| Comments | Building ID created in QBuildings | x coordinate in EPSG:2056 | y coordinate in EPSG:2056 | z coordinate in EPSG:2056 | Federal identifier | Building classes from SIA 380/1 | Share of agglomerated EGID in the final building, by area | SIA 2024 standard | Transformer to which the building is associated | True if connected to the gas grid | Number of habitants, from standard of cap/m2 | Energy reference area | Area of the floor | Roof area available for solar installations | Area of the facade, from envelope computation | U heating coefficient of the building | Inertia of the building against thermal fluctuations | Demand temperature | – | – | – | – | True if hot water is needed | Energy carrier for heating (oil, gas, …) | Energy carrier for hot water production (oil, gas, …) | Yearly SH demand | Yearly cooling demand | Yearly DHW demand | Electrical demand, from SIA 2024 | Geometry object for GIS database, from envelope computation |
| Fields | id_roof | egid | id_building | area_roof_solar_m2 | mean_annual_irr_kWh_m2_y | roof_annual_irr_kWh_y | tilt | azimuth | Unnamed | Geometry |
| Comments | UUID from Sonnendach | EGID identifier | ID created in QBuildings | Useful roof area | In kWh/m2/y | Total irradiance on the roof, in kWh/y | In degree | Orientation, in degree | - | Geometry object, polygons |
| Fields | id_facade | egid | id_building | area_facade_solar_m2 | mean_annual_irr_kWh_m2_y | facade_annual_irr_kWh_y | azimuth | Geometry |
| Comments | UUID from Sonnenfassade | EGID identifier | ID created in QBuildings | Useful facade area | In kWh/m2/y | Total irradiance on the roof, in kWh/y | Orientation, in degree | Geometry object, lines |
| Fields | id | P_load | Q_load | id_HV | id_EHV | Geometry |
| Comments | Transformer ID created in QBuildings | Active power, in kW | Reactive power, in kW | ID of the High Voltage transformer to which it is linked | ID of the Extra High Voltage transformer to which it is linked | Geometry object, polygon |
1.2.3 Smoothed
The data aggregation from various layers and the computation of new data may have created some extreme values. The data set is smoothed so that the outliers are removed.