6 Neighborhood Typification
Regarding the discussion developed in section 4.1 the most suitable zoning for the implementation of CEL on the canton of Geneva is the zoning in statistical sub-sector GIREC. Indeed it is the one that presents the most pros and the fewer cons. Therefore it is the zoning that has been used for the following neighborhood typification presented in this section.
6.1 Clustrering results
Figure 6.1 shows the mean BIC and AIC scores over the 500 iterations made of full-matrix Gaussians. Only the full covariance matrix shape is shown, as it has always obtained the best score.The optimal number of cluster is indicated by the elbow method for AIC metric and by taking the min score for BIC metric. Figure 6.2 shows the occurrence of optimal number of clusters across the 500 iterations for BIC and AIC methods.
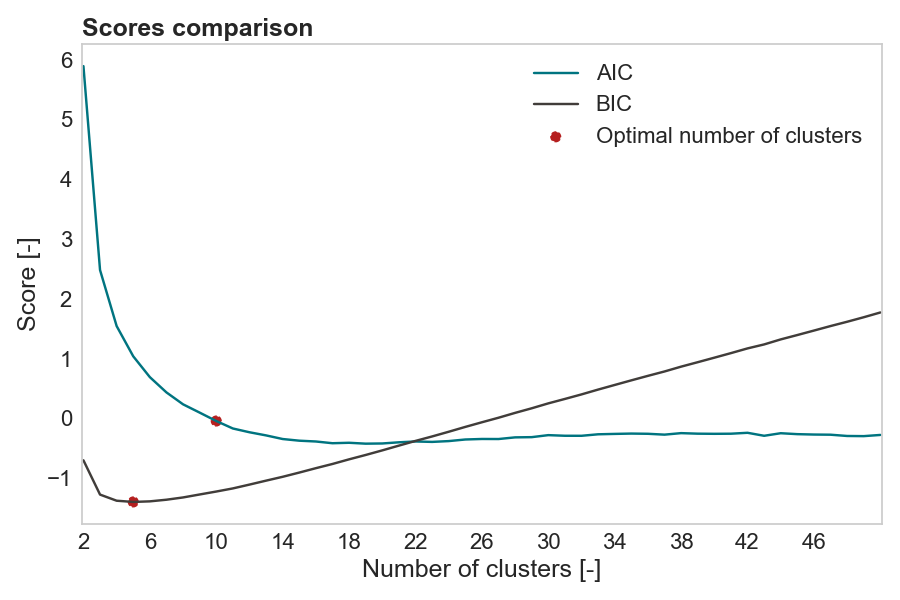
Figure 6.1: Mean AIC and BIC score in function of the number of clusters
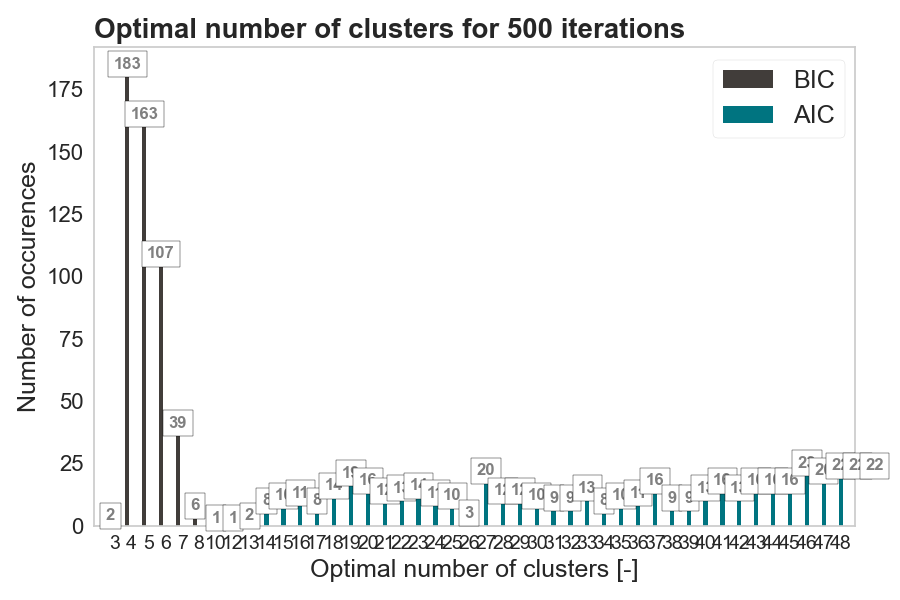
Figure 6.2: Number of optimal cluster for 500 iterations
Note that the BIC metric penalizes more models with a important number of parameters than what does AIC. In the case, of clustering it allows to discriminate better models that perform well but which have few parameters. In this study it is thus more relevant to use the BIC metric than the AIC one : the optimal number of clusters is therefore 4 in this case.
6.2 Neighborhood typification
Once the optimal number of clusters is found, one can perform the typification of each neighborhood. Buildings characteristics of each neighborhood archetypes are first presented before comparing them to Joseph Loustau’s work (Loustau et al. 2023). In his paper, Loustau used a zoning based on Voronoï partitioning of the territory : The neighborhoods are defined according to the LV transformers to which the buildings are connected but because the position of transformers is not publicly available, it uses the synthetic grid approach from the work of Rahul Gupta [citer], which estimates the position of transformers based on the buildings’ energy demands and through Vornoï partitioning.
6.2.1 Characteristics
Figure 6.3 shows the characteristics of typical buildings that can be found in each neighborhood archetype. Note that values are normalized using gaussian normalization method :
- Cluster 1 - Carre-d’Aval - Rural neighborhood with high PV potential (farms, shed): High heating demand and PV potential, low electrical demand and waste production
- Cluster 2 - Octroi - Residential neighborhood: High heating and DHW demand and waste production, low PV potential and electrical demand
- Cluster 3 - Boissonnas - Industrial and business neighborhood: High electrical demand and energetic reference area (ERA), low DHW demand and waste production
- Cluster 4 - Nant des Crues - Rural neighborhood with low PV potential (village houses, villa): High waste production, low electrical demand.
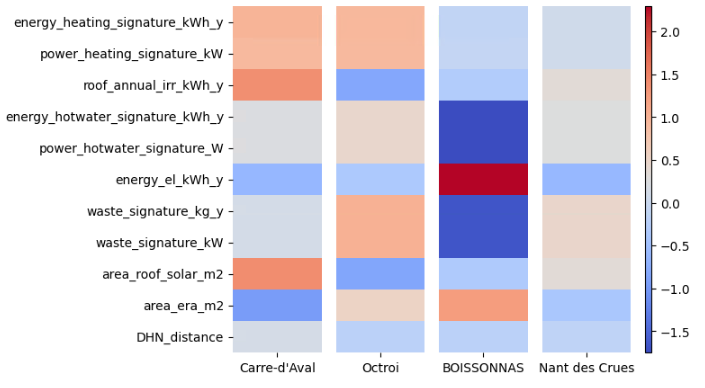
Figure 6.3: Characteristics of each archetype of neighborhood
Figure 6.4 represents the map of the canton of Geneva partitioned with GIREC neighborhoods each one associated to an archetype of neighborhood. The positioning of each archetype across the territory supports the description of each archetype.
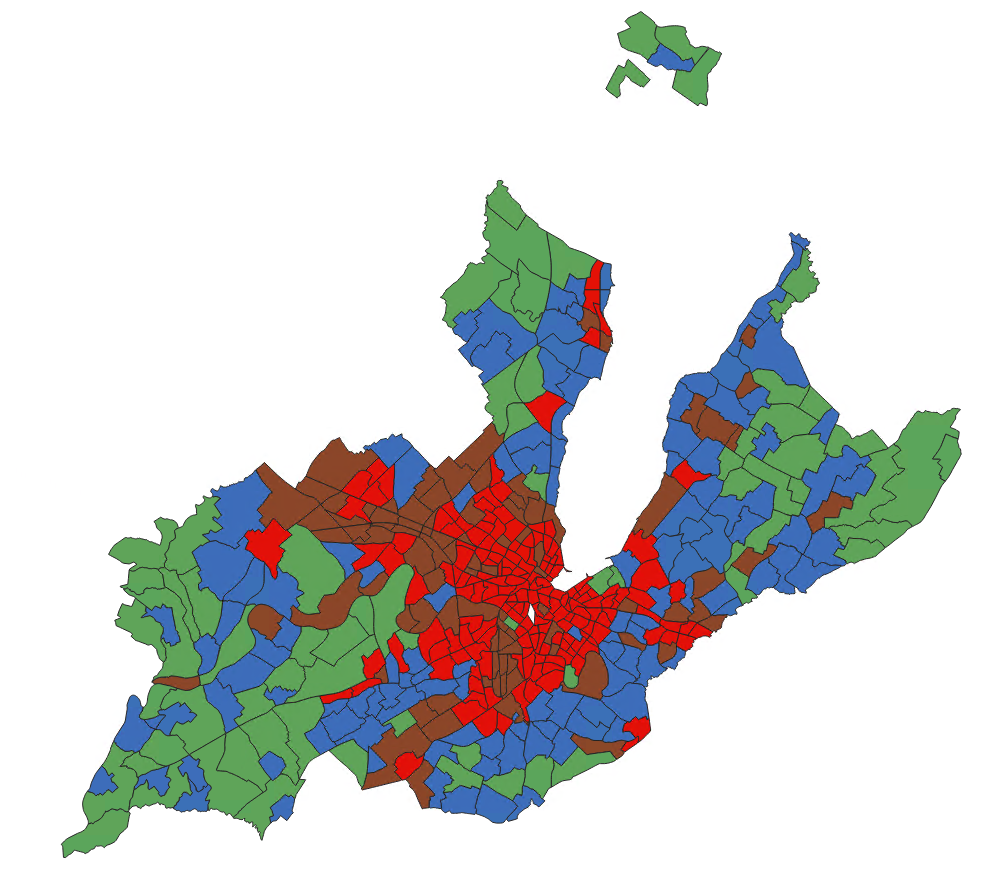
Figure 6.4: Typification of GIREC neighborhood in Geneva
6.2.2 Comparison with Voronoï zoning
In Loustau’s work, clustering is performed using Voronoï partitioning (Gupta, Sossan, and Paolone 2021) but without taking into account a building parameter that is here important : the distance to heating network. This is an import feature since the Catonal Officen of Energy (OCEN for Office Cantonal de l’Énergie in French) ask for a mandatory connection to a heating network for buildings nearby this kind of network (Swiss Federal Assembly 2016). The clustering using Voronoï partitioning has therefore also been performed using this additional parameter. The results of the assessment of the algorithm are not presented here because the method had been the same as the one used with the GIREC zoning. The optimal number of clusters was found to be also 4.
Once the 2 sets of neighborhood archetypes were found, a match between the two sets was performed in order to estimated which archetype of one set corresponded to which archetype in the other set. The matching has been done by computing the euclidean distance between each pair of archetypes between the two sets. Repetitions were possible leading to 16 the number of distances to compute. However no repetition occurred and a perfect match was obtained. Figure 6.5 shows the characteristics of typical buildings that can be found in each neighborhood archetype for both partitioning : Archetypes inside a same pair are very similar to one another for each pair.
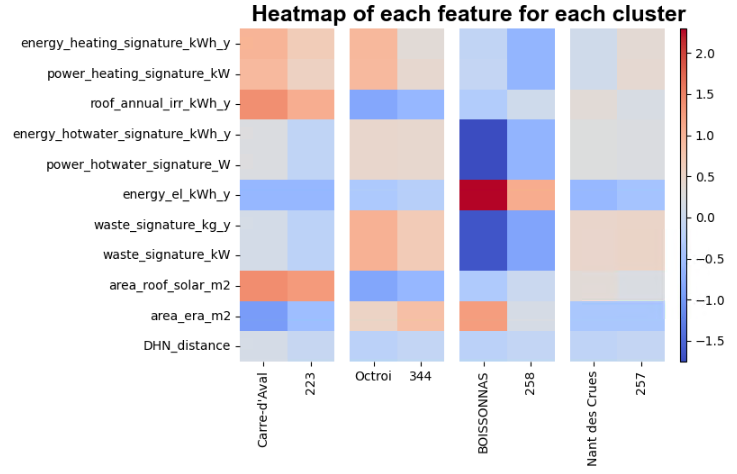
Figure 6.5: Characteristics of each archetype of neighborhood for each partitioning
Figures 6.6 and 6.7 show the positioning of Voronoï neighborhoods with their archetype label across the territory. GIREC neighborhoods and their label have been kept so it is possible to compare the location of each neighborhood archetype over the canton. The location of each neighborhood archetype is more or less similar. Archetype 2 and 3 are particularly similar from one zoning to the other. This could be explained by the fact that these neighborhood archetypes are more different from all other archetypes than archetypes 1 and 4 which are both rural neighborhoods.
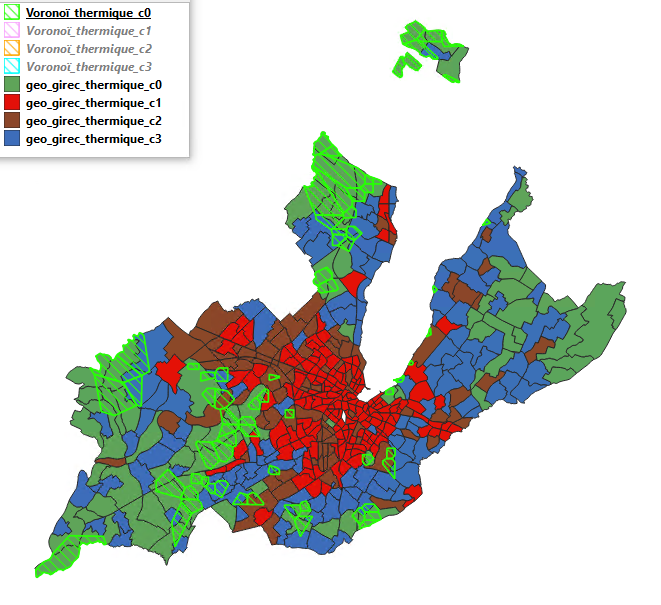
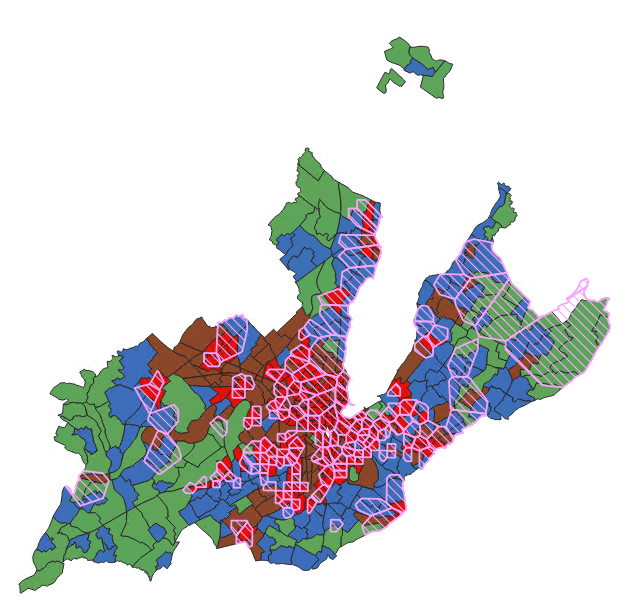
Figure 6.6: Left: cluster 1; Right: Cluster2
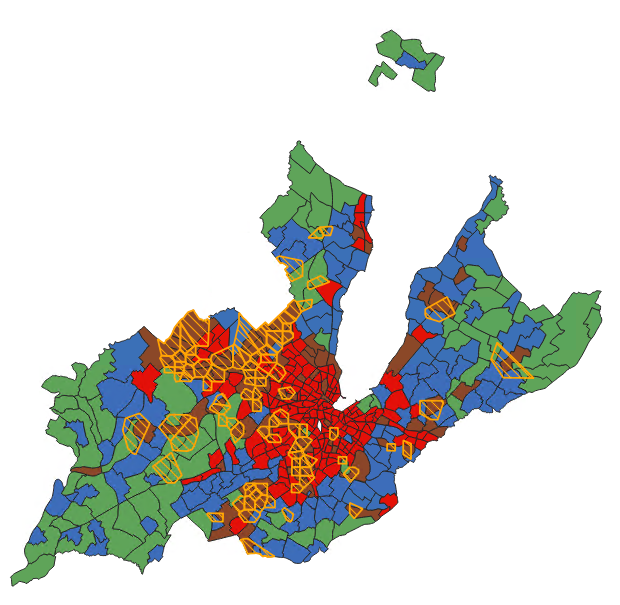
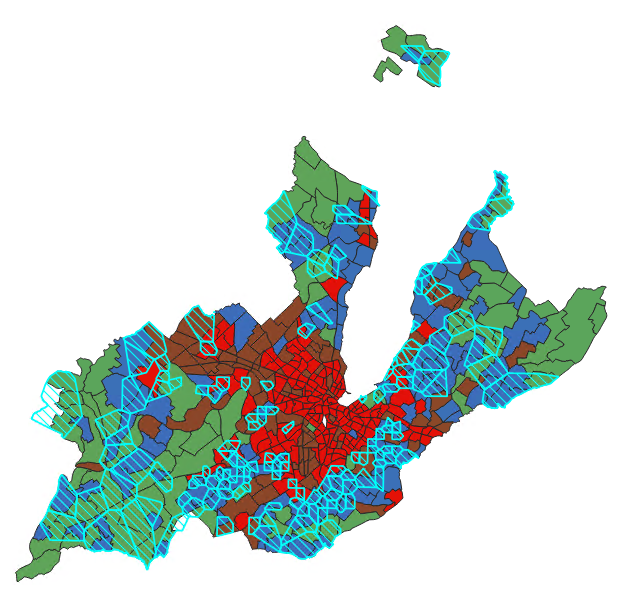
Figure 6.7: Left: cluster 3; Right: Cluster4
Finally, a comparison between each neighborhood distribution inside their own archetype category is performed for every dimensions that characterized a building during this typification process : Figure 6.8 presents the obtained results. As expected since, the number of archetypes are the same, characteristics of buildings of neighborhood archetypes and location of archetypes looks alike for both zonings, the distribution of neighborhoods inside their own archetype category is also similar for one zoning to the other. Note that every dimensions are normalized.
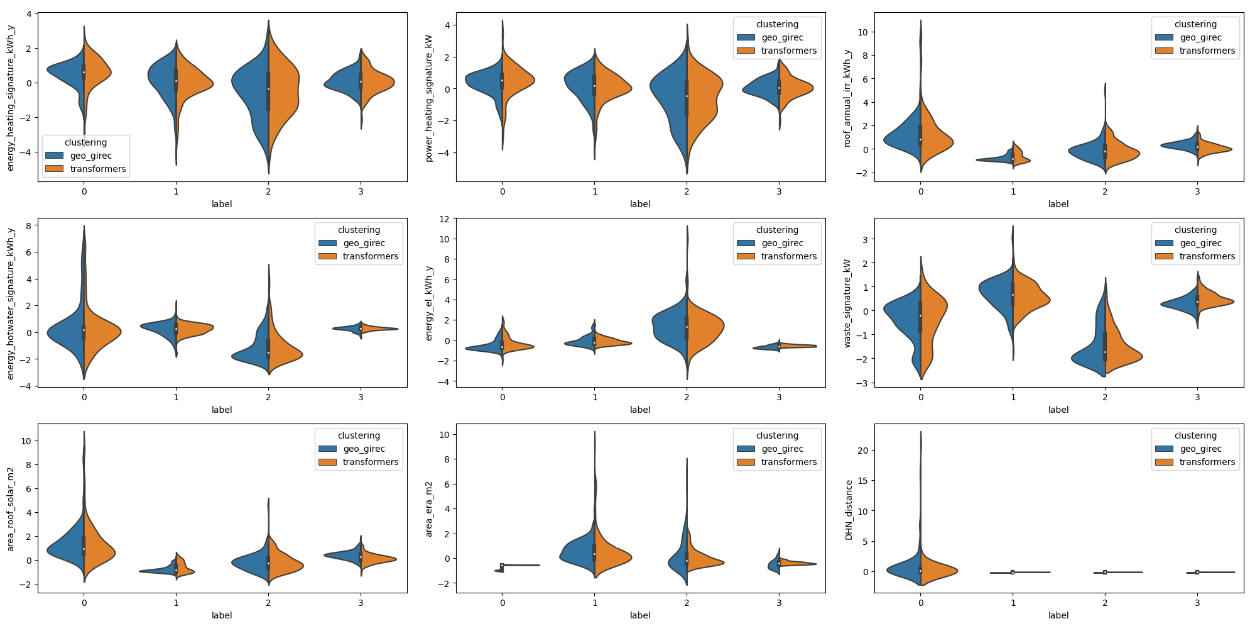
Figure 6.8: Comparison of distribution of neighborhoods inside their cluster category for the Girec and Voronoï zoning
6.3 Summary
With two different approaches of zoning, the results of the neighborhood typification are very similar. Indeed, Voronï zoning is a theoretical zoning and is based only on electrical consumption of buildings. On the other hand GIREC zoning is an official zoning derived from a pragmatic approach that addresses the needs of the administration. This means that a neighborhood has therefore a physical but also an administrative meaning for the case of Geneva. Plus, it means that in the present case, the administrative zoning forms neighborhoods relatively distinguishable from one another in terms of energy consumption. Therefore the usage of Girec zoning is advised for conceptualizing macroscopic energy concept but also for identifying similar neighborhood in terms of energy consumption and production.