6 QBuildings
QBuildings has been able to generate data on the whole Geneva canton. On the 56’175 entries initially described by the register, 6’039 are missing, representing a 10.75% loss. The loss is due to the situation explained in Figure 4.4 but also to missing 3D for some buildings. Finally, sometimes the buildings are well-referenced, but their shape makes it harder to join the layers by spatial location. Figure 6.1 shows a situation where the RegBL point does not intersect with the cadaster geometry. The building has a patio where the point falls. As such, this building is not kept.
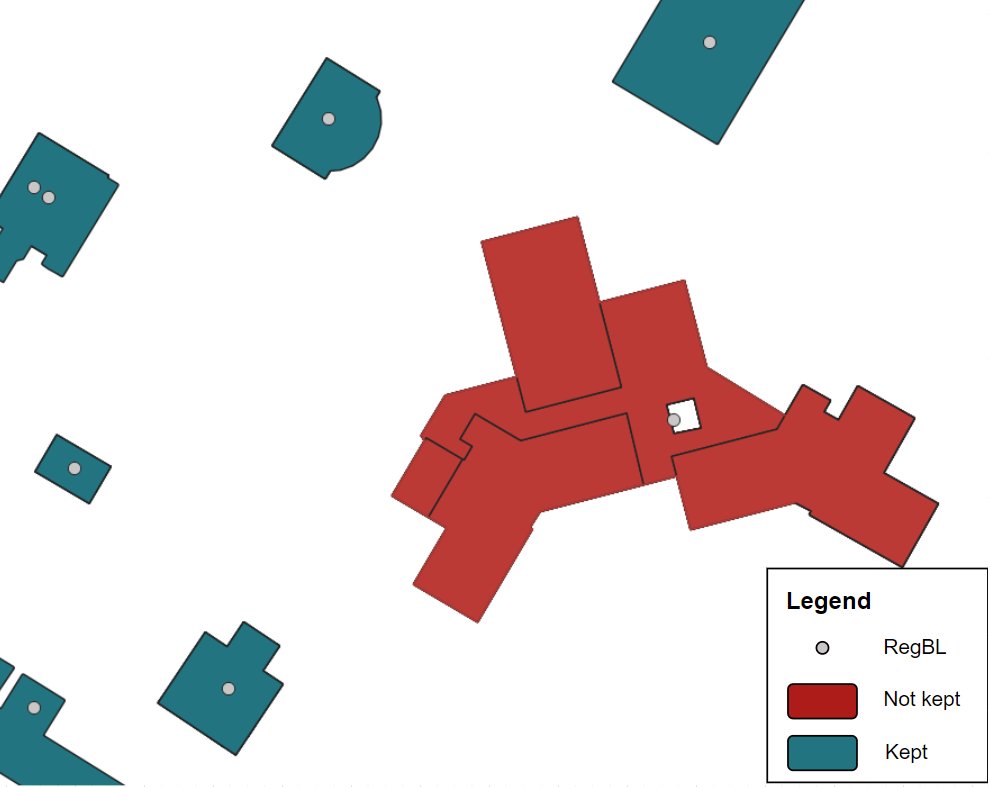
Figure 6.1: Output of QBuildings with a patio in the center.
6.1 Heat demands validation
On energetic considerations, the heating signature is compared to the SITG figures from the buildings’ heat expenditure index (Indice de dépense de chaleur des bâtiments, (SITG, 2021)). This dataset includes the yearly heat demand, the share of DHW in it, the Energy Reference Area (ERA) and whether the data is from on-site measurements or not. The data concerns mainly the buildings in the city of Geneva rather than the Canton. The comparison is done building by building, by identifying with a spatial join buildings from SITG database with the one from QBuildings. Table 6.1 presents the mean and median difference of SH and DHW demands by buildings. It also shows the difference in ERA considered. Finally, it has the SH and DHW demands divided by the ERA. The full data are available at Appendix 11, Figure 11.2.
| Mean | Median | Mean | Median | Mean | Median | Mean | Median | Mean | Median | |
|---|---|---|---|---|---|---|---|---|---|---|
| SITG | 92.66 | 91.13 | 38.00 | 36.41 | ||||||
| Processed | -41.94 | -2.28 | -543.6 | -221.22 | -30.88 | -3.27 | 94.32 | 91.94 | 10.64 | 11.52 |
| Smoothed | -42.5 | -2.29 | -553.28 | -223.78 | -30.88 | -3.27 | 94.19 | 91.86 | 10.64 | 11.52 |
On average, the QBuildings SH demand is 42% lower than the one from SITG. For the DWH, the demand is five times higher on the SITG side. Part of those differences is explained by the difference of ERA considered, which is 30% higher for the SITG. This ERA difference might be explained by the fact that SITG group some buildings data without having the corresponding geometry.
An example of that situation can be seen in Figure 6.2. The yellow building has a geometry area (corresponding to the net floor area) of 84m2, on which the dataset from SITG and QBuildings agree. The RegBL indicates the building has two floors, and as such, an ERA of approximately twice the value is expected. QBuildings gives \(ERA=114m^2\) while SITG has \(ERA=2164m^2\), which would be a 26 floors building.
This lead to cases where the difference gets enormous. It makes sense to look at the median to avoid this pitfall. The difference is now only 3.3%, much more acceptable. Looking at the demands per area, one can see that the SH demands are coherent, whereas the DWH demand is 3 to 4 times higher for the SITG. In the last case, the demand is computed by stating a coefficient on the DHW share on the total demand. The mean is around 30%, while in QBuildings it is around 10% (which corresponds to the share of buildings constructed before 1975).
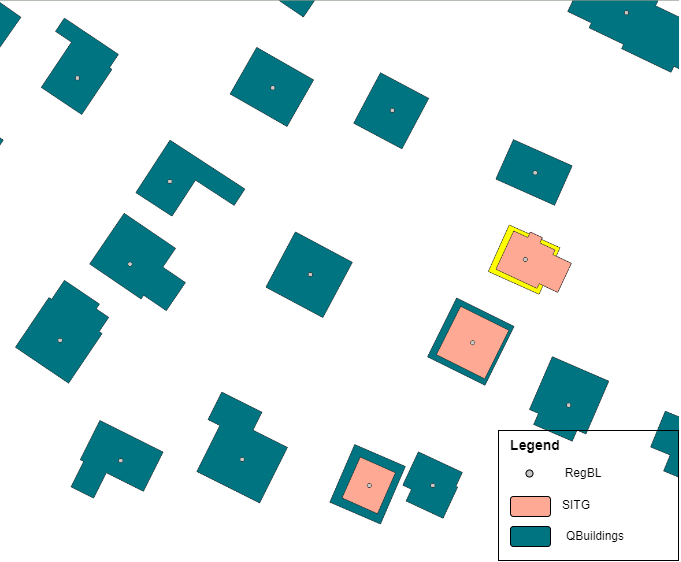
Figure 6.2: Case where ERA and geometry area do not match.
An additional comparison is made with SIA norms to go further in the analysis. The SIA 380/1 standard aims to promote the rational and economical energy use for heating buildings (Brüttisellen-Zurich, 2016). It gives a basic demand, a limit demand and a target demand. The demands are computed from statistical studies on buildings categories. The SIA 2024 standard provides room usage data, including heating data, also given pre-defined categories (Brüttisellen-Zurich, 2021). On the same set of buildings, SIA figures for the SH and DHW per ERA are available in Table 6.2. Table 6.2 also reminds the values found for SITG and QBuildings. As can be seen, the mean and median SH demand is coherent with both the SITG and QBuildings. Concerning the DHW, QBuildings figures are under the SIA demand while the SITG are above. A visualisation of the modelled SH and DHW demands for a SITG building set sample is offered from Figure 6.3 and Figure 6.5, respectively. The buildings are plot versus their demands. From the last, it is clear the DHW demand from SITG does not match with the rest. One explanation is from the DHW estimation method that does not allow the same level of precision by building: it computes the DHW demand as a share of the total heat demand, represented by a coefficient. This coefficient is most of the time either 0.3 or 0. Yet, this share can vary a lot with the building’s category and above all period. Indeed, recent buildings tend to have a much better insulation, which in turn increases the share of the DHW in the demand. From, the SITG database, the period distinction has not been made. However, the shape of the curve follows the one from QBuildings.
Figure 6.4 and Figure 6.6 plot every building, respectively sorted by QBuildings SH and DHW demand. The shapes of SITG and QBuildings lines do compare, while it is not the case for SIA curves.
SIA values correspond to what one could expect from a building, statistically from similar buildings, in terms of category. On the contrary to QBuildings, it does not take into account the construction period and so the set of possible value/m2 is smaller. It is therefore very possible that there are some differences locally.
On the DHW demand, QBuildings bases its estimation on the SIA380/1 number of capita in the building and SIA 385/2 on the use of hot water per capita per day. The standard 385/2 being specialised on hot water installation sizing, it may allow a higher precision of the computation method, explaining why QBuildings differs from SIA results while using only SIA figures.
| Mean | Median | Mean | Median | |
|---|---|---|---|---|
| SIA 380/1 | 40.01 | 35.90 | 19.38 | 21.00 |
| SIA 2024 | 104.42 | 103.31 | 16.25 | 18.00 |
| SITG | 92.66 | 91.13 | 38.00 | 36.41 |
| Processed | 94.32 | 91.94 | 10.64 | 11.52 |
| Smoothed | 94.19 | 91.86 | 10.64 | 11.52 |
Figure 6.3: Comparison of QBuildings heatings requirements with SIA norms.
Figure 6.4: Comparison of QBuildings heatings requirements with SIA norms with buildings sorted by 2024 demand.
Figure 6.5: Comparison of QBuildings DHW demand with SIA norms.
Figure 6.6: Comparison of QBuildings hot water requirements with SIA norms with buildings sorted by 2024 demand.
Finally, the heating and hot water needs data from the Sonnendach were too incomplete to make a proper comparison.
From those considerations, the space heating and domestic hot water demand values from QBuildings are kept knowing that the DHW may be underestimated. It would be interesting to cross the output with actual measurements for future works.
Smoothed data
Figures 6.7 represent the boxplot of the heating demand figures before and after smoothing the data set. The Smoothed data were very close to the Processed one for the SH demand. This situation is explained by the demand/m2 depending only on the period and category, which enables a total of 80 combinations. It can also be noticed that the median does not change by a lot and the values from Table 6.1 are retrieved. On the other hand, the hot water demand is much more scattered, as shown on the boxplot of the hot water demand (Figure 6.8). The explanation must lie in the fact it relies on more different estimations to be computed. The computation on DHW seems again less reliable.
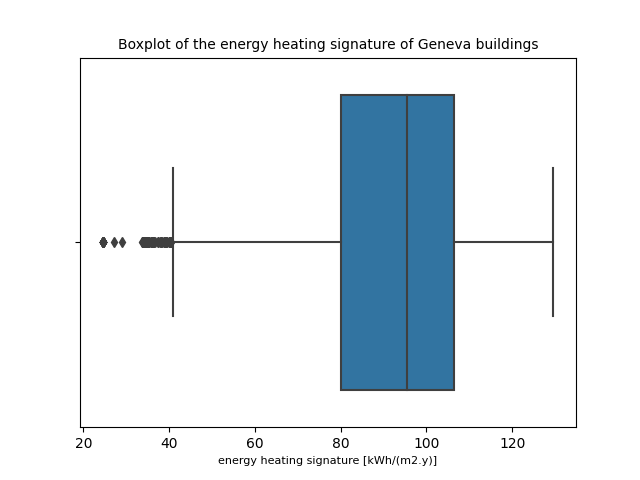
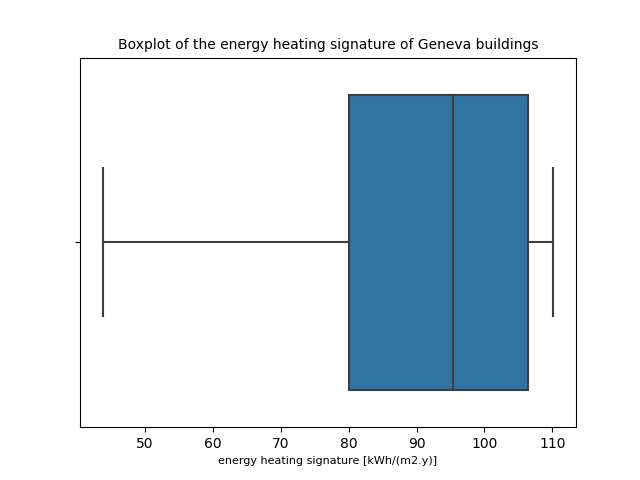
Figure 6.7: Boxplot of the SH demand per m\(^2\) for Geneva canton buildings, before and after the winsorization.
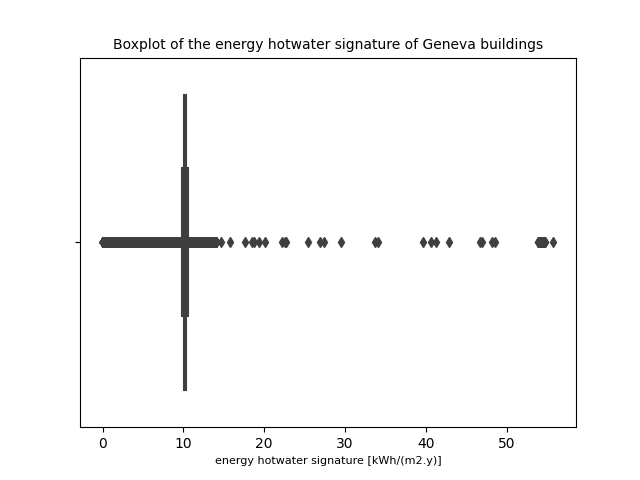
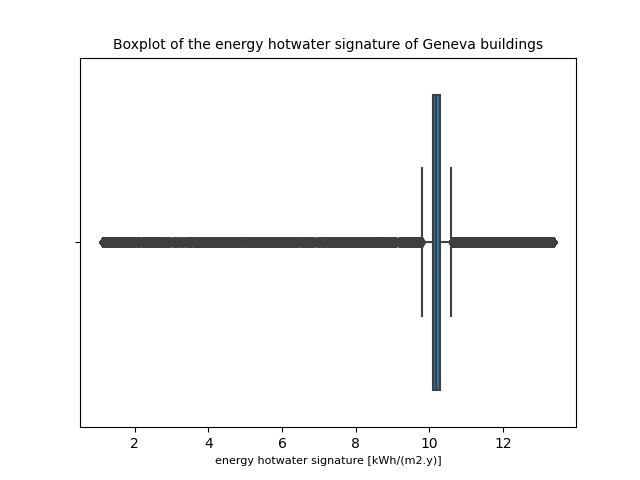
Figure 6.8: Boxplot of the DHW demand per m\(^2\) for Geneva canton buildings, before and after the winsorization.
6.2 Irradiance validation
The same approach is used to validate the solar potentials. The reference dataset is Photovoltaic potential per useful area (Potentiel photovoltaïque par surface utile, (SITG, 2022)). It includes the tilt, the useful area, the mean irradiance per surface and the total annual irradiance. Similarly to the precedent tests, the areas considered are much different. QBuildings uses data from Sonnendach who states in the methodology the useful roof area does not take into account particularities of a roof, such as the presence of chimney or skylights. The area found from it is then wider than the area from a more local and precise study such as the one from SITG. Figure 6.9 illustrates this difference, with the QBuildings roof in blue much bigger than the pink one from SITG. On this particular example, the top of the buildings is a terrace and is considered available for QBuildings, and not for the SITG that keep only the roof of the stairwell.
Once the error due to the area is eliminated, the irradiance data is very much coherent, with a mean difference between the two datasets of 3%. The complete data are available in Appendix 11.
| Mean | Median | Mean | Median | Mean | Median | |
|---|---|---|---|---|---|---|
| SITG | 242.99 | 68.16 | 296.82 | 82.96 | 1209.98 | 1207.00 |
| QBuildings | 611.54 | 273.78 | 727.55 | 319.96 | 1180.66 | 1197.21 |
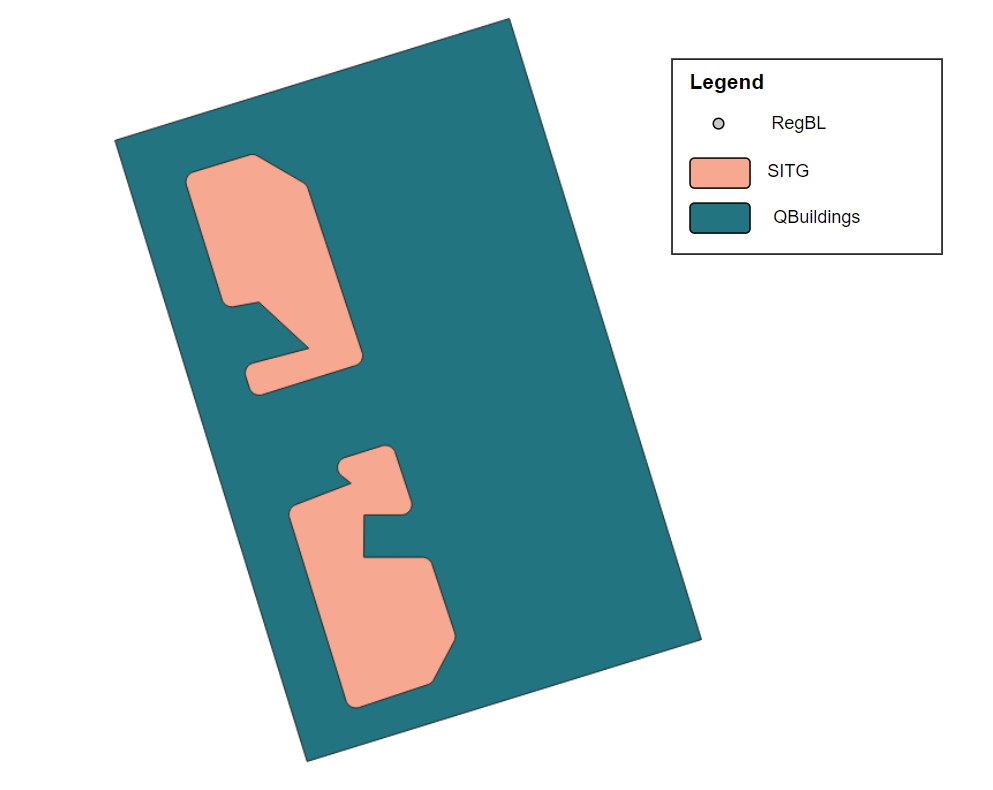
Figure 6.9: Example of a flat roof building.
References
© EPFL-IPESE 2022
Master thesis, Spring 2022
Joseph Loustau